Why do movies fail?
Some movies win Oscars for excellence in cinematography, others are nominated for Raspberry awards or “razzies” for flopping performances.
In this story, we focus on the latter, conducting research into the common characteristics of low-rated movies. First, we analyze the data
from the low-rated movies in general. Then, we will proceed to investigate if they have something in common and finally, we will apply machine
learning methods to see if we can predict which movies fail. Get your popcorn ready and enjoy!
The subpar movies
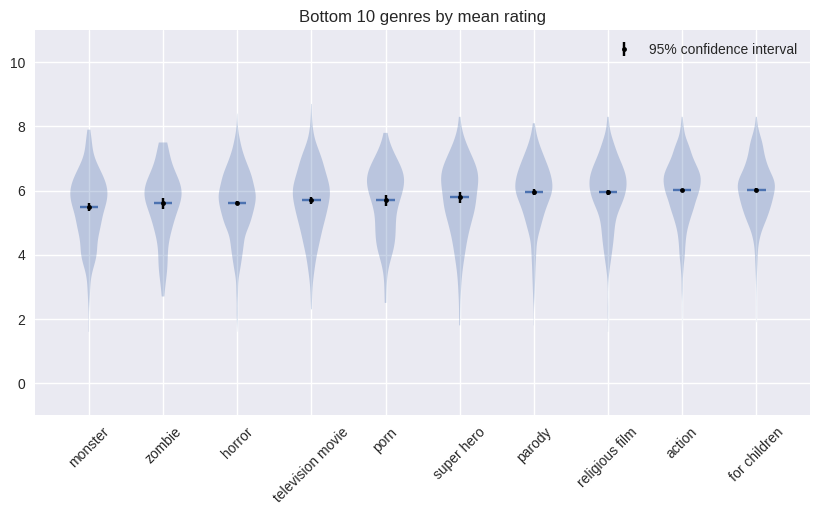
Let us first take a look at the available data. Our dataset was obtained from IMDb, which is an online database of information related to films, series and content related to them. For getting a general idea about the average ratings of movies, an interactive plot can be used to see how the average ratings of movies of certain genres have developed throughout the years. Genres have been pre-processed to combine similar genres, such as different fields of sports, into one single genre. Additionally, only genres with at least 100 movies have been considered to filter out rare genres, such as Bengali movies.
From the plot, we can observe some genres like anime, animation and world cinema having consistently high average ratings and on the other hand genres like monster, zombie and television movies having consistently low average ratings. Analyzing the worst movies over the time period of observed data, we found that the worst average ratings belonged indeed to monster movies, with an average of 5.49 and 95% confidence interval of [5.39, 5.62]. The worst genres in terms of average are:
Now that we have looked at the genres, let's take a look at how the average rating of a movie is affected by the country in which it is made. Below is a map with each county colored according to the average rating of movies made in that country. Note that the means between countries with bigger sample sizes do not vary as much as the means of small countries due to the regression towards the mean phenomenon.
The recipe of a flop
A pinch of this, a pinch of that... but a pinch of what?We have now taken a look into the available data, but we still have to answer the main question: what makes a bad movie? If we are able to answer it, we might be able to create predictions from the data. Thus, our next goal is finding some common features between the worst rated movies.
Before we begin, there is one crucial data preprocessing step to be done. Since the ratings that we will analyze are given by internet users, the rating of a movie might be very noisy if the movie is rated by very few users. For instance, suppose a movie only has one voter, and that voter hates the movie with passion. Thus, we decided to drop movies rated by fewer than 10 users, which is a reasonable threshold. The plots shown previously have been produced after this preprocess.
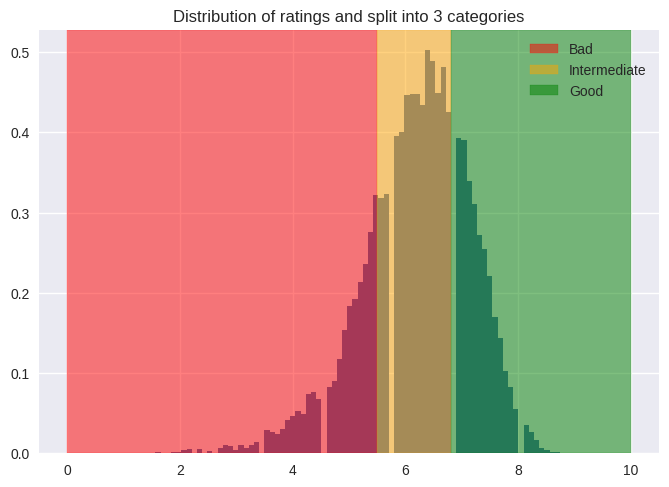
First, it is necessary to clarify what we are considering a bad movie based on the reviews. As we can see in the graph below,
we splitted the data into 3 categories, bad [0-5.5), intermediate [5.5, 6.8) and good [6.8, 10], resulting in 3,488 bad movies,
7,821 average movies and 3,980 good movies.
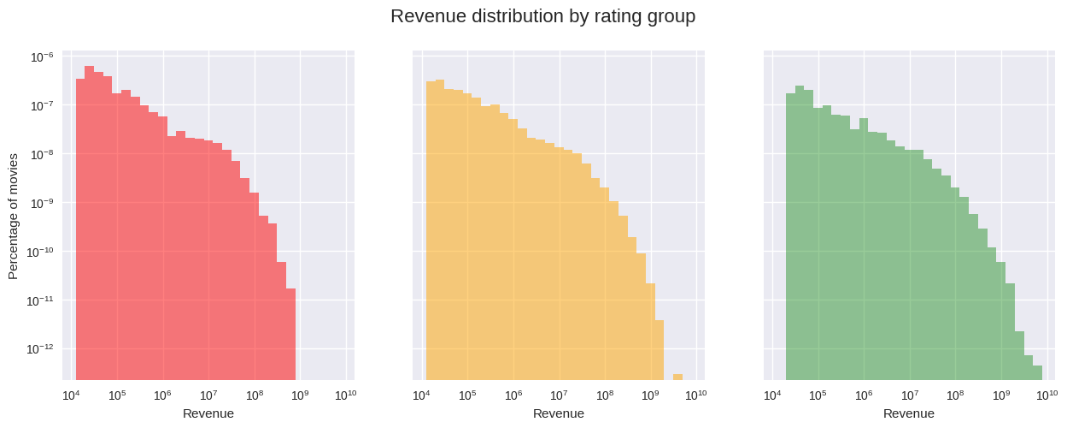
In addition to the genre and country of the movie, the other two basic features to consider are the budget and revenue to predict
the rating of the movie, both given in USD and adjusted for inflation. Our hypothesis was that worst movies have lower budget and
revenue in comparison with the other categories, which can be observed in the graphs and was confirmed by performing a simple
t-test1.
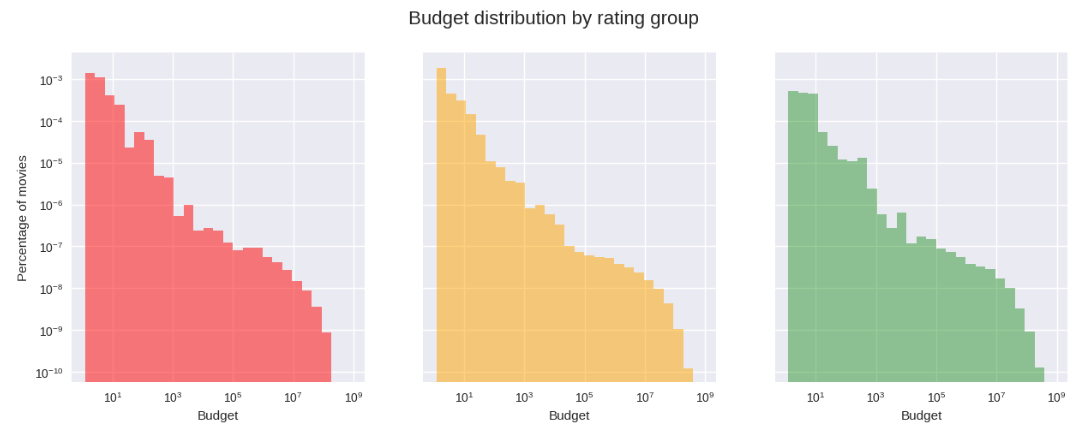
 1The null hypothesis was that the average budget and revenue for bad movies is the same as for other movies,
which was rejected with a p-value of 0.015 and 0.000 respectively
1The null hypothesis was that the average budget and revenue for bad movies is the same as for other movies,
which was rejected with a p-value of 0.015 and 0.000 respectively
It seems there are some differences in the revenue and budget distributions across the rating groups. This might indicate that rating is correlated with both budget and revenue. Thus, the next question is whether we can predict the rating of a movie with these features.
Next, we split the data into training and test sets and trained a Random Forest model on the training set to predict the rating, as a regression problem. The features are budget, revenue, year, runtime, genres and contruies. The model achieves an R2-score of 0.369 on the test set, which is not very high.
On the other hand, what if we change lenses to simplify it and convert the prediction task into a binary classification problem? Are we able to determine whether a movie has a rating value below 5.5 with these features using a Random Forest classifier?
To address class imbalance, we upsample the minority class (rating below 5.5) during training. We obtained an AUROC value of 0.77 and a f1-score of 0.51, which means the model can be improved, but it is not the worst. Note that we consider these metrics because we are dealing with an unbalanced classification problem.
However, are we in the right direction with the features selected? By checking the importance of the features of the classifier, we obtained that the most important features were the four numerical ones: runtime, revenue, year and budget. This was verified by computing another classifier without these features and comparing the results, where the accuracy of the latter had worsened. The AUROC of this model is 0.76 and the f1-score is 0.48.
Therefore, to continue with the task of predicting the rating from the data, we should extract more features, as we might be missing some ingredients in this recipe of a flop.
More ingredients
Let's do some grocery shopping...Competition effect
When thinking about the key performance metrics of a movie, it is intuitive to consider the competition between movies released within a time period. We define define this as a compound of:
- The number of movies released the same week
- The number of movies released the same month
- The number of movies released the same year
- The number of movies released the same week of the same genre
- The number of movies released the same month of the same genre
- The number of movies released the same year of the same genre
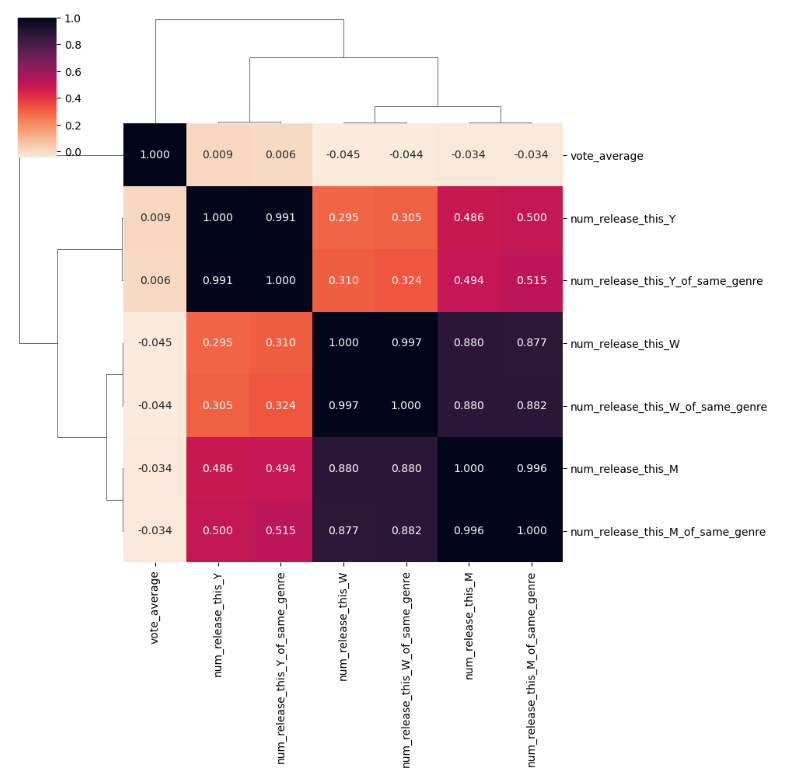
So, in order to validate this intuition, we can check the correlation between each new feature and the rating.
We can see that grouping by genre is not really useful as the values are very correlated with the non grouped values,
so we will only use the non grouped values. Also, the number of movies released the same week, month or year are not
highly correlated with the rating. Nevertheless, we can still note the negative correlation between the number of
movies released the same week or month and the rating, which is the opposite of the relationship between the number
of movies released the same year and the rating (positively correlated).
Repeating the same steps as before, as well as adding the competition features, our Random Forest Regressor’s R2 slightly increased by 0.001. Fortunately, the Classifier got a bit better, with its f1-score becoming 0.52 (+0.01). In addition, after checking the feature importances of the classifier, we confirmed that the competition features were among the most important features, with the number of movies released this year being the fifth most important.
Keywords analysis
The next logical step is studying the plot of the movies. However, as keywords can be considered as a condensed version of the plot summaries and are easier, we are going to focus on them first and see its impact. It is noteworthy that keywords also contain information about the tropes of a movie, in some sense (such information is not directly available from the plot summaries).
The best way to proceed is to cluster these keywords into topics by considering the list of keywords for each movie as a document, and then use Latent Dirichlet Allocation for topic modelling. Then, we could use the most probable topic of a movie to predict its rating. We set the number of topics to be 20 and let the LDA model find the most salient words for each topic. As shown in an interactive figure below, we got nicely separated topics with recognizable themes.
However, we observed that the topics looked very similar to each other and there was not much variance
between them; thus, not being helpful for predicting, as it can be seen below.
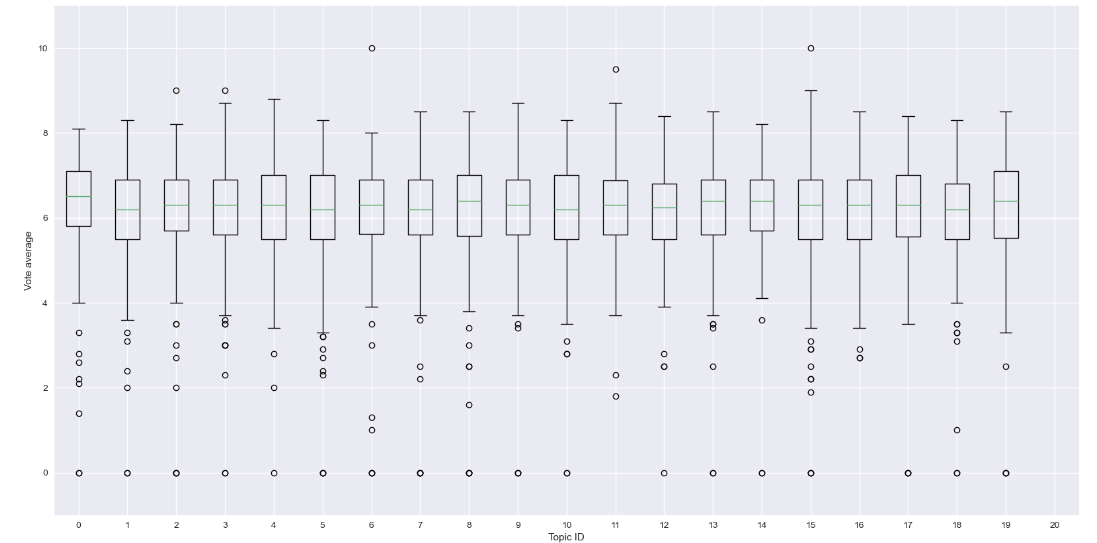
The AUROC and f1-score obtained are 0.81 and 0.52 respectively, which is a slight improvement over previous models. However, when we checked the feature importances, it is clear that these new keyword topic features do not help at all. Thus, it is unlikely that keywords (the content of the plot summary and the tropes) play a big role in determining the rating of a movie. Although the topic modeling visualization was helpful for us to understand what sorts of movies are in the dataset, the keyword topics are not correlated to the ratings, and hence they are not useful for predicting the ratings.
Conclusion
Was our recipe good?Conclusion
In general, although we could find some correlations between the movie features, such as budget and revenue and the ratings of the movies, it is not at all trivial to use those features to predict the ratings. This is already after identifying an extensive set of candidate features. This finding makes sense because if it were possible to predict movie ratings, certain movie producers would have already dominated the theaters by now. However, even if prediction is difficult, the features we identified are still useful in understanding the general characteristics of failing movies.